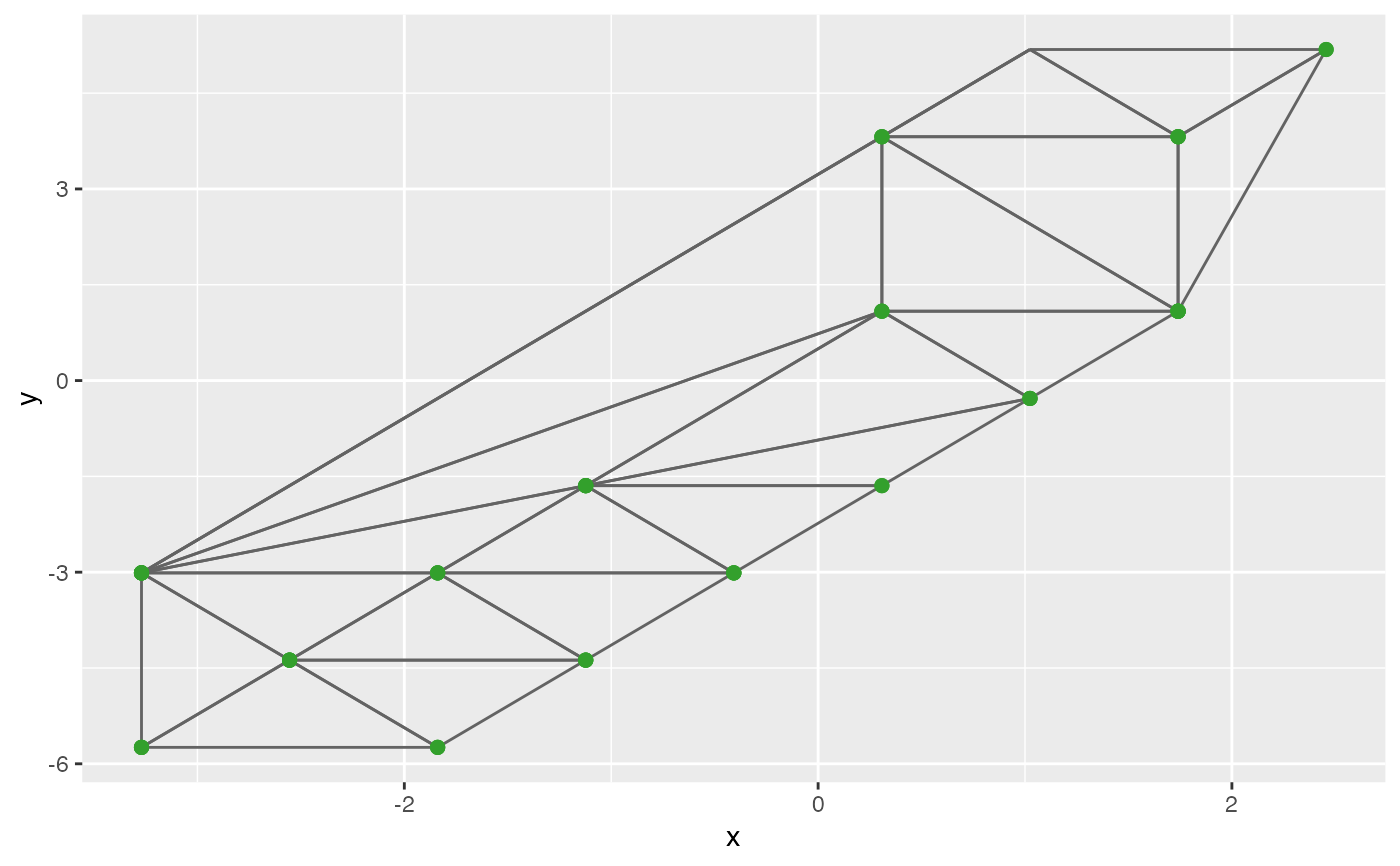
Create a trimesh plot
Usage
geom_trimesh(
  mapping = NULL,
  data = NULL,
  stat = "trimesh",
  position = "identity",
  show.legend = NA,
  na.rm = FALSE,
  inherit.aes = TRUE,
  ...
)
Arguments
- mapping
Aesthetic mappings for the plot.
- data
The data to be plotted.
- stat
The statistical transformation to be applied.
- position
The position adjustment to be applied.
- show.legend
Whether to show the legend for this layer.
- na.rm
Whether to remove missing values.
- inherit.aes
Whether to inherit aesthetics from the plot or the layer.
- ...
Additional arguments to be passed to the `layer` function.
Examples
# Basic usage
num_bins_x <- 4
shape_value <- 1.833091
hexbin_data_object <- extract_hexbin_centroids(nldr_df = s_curve_noise_umap,
num_bins = num_bins_x, shape_val = shape_value)
df_bin_centroids <- hexbin_data_object$hexdf_data
ggplot2::ggplot() + geom_trimesh(data = df_bin_centroids, mapping = ggplot2::aes(x = x, y = y))