To generate the full hexagonal grid, you need to start from the bin
centroid info that obtained from
extract_hexbin_centroids().
## Data set with all possible centroids in the hexagonal grid

full_centroid_df <- generate_full_grid_centroids(df_bin_centroids)
full_centroid_df
#> # A tibble: 50 × 2
#>         x     y
#>     <dbl> <dbl>
#>  1 -3.27  -3.27
#>  2 -1.84  -3.27
#>  3 -0.407 -3.27
#>  4  1.02  -3.27
#>  5  2.46  -3.27
#>  6 -3.27  -1.92
#>  7 -1.84  -1.92
#>  8 -0.407 -1.92
#>  9  1.02  -1.92
#> 10  2.46  -1.92
#> # ℹ 40 more rows

## Generate all coordinates of hexagons
hex_grid <- full_hex_grid(full_centroid_df)

ggplot(data = hex_grid, aes(x = x, y = y)) + geom_polygon(fill = "white", color = "black", aes(group = id)) +
  geom_point(data = hex_grid, aes(x = x, y = y), color = "black") +
  geom_point(data = df_bin_centroids, aes(x = x, y = y), color = "red")
ggplot(data = hex_grid, aes(x = x, y = y)) + geom_polygon(fill = "white", color = "black", aes(group = id)) +
  geom_point(data = full_centroid_df, aes(x = x, y = y), color = "black") +
  geom_point(data = df_bin_centroids, aes(x = x, y = y), color = "red")
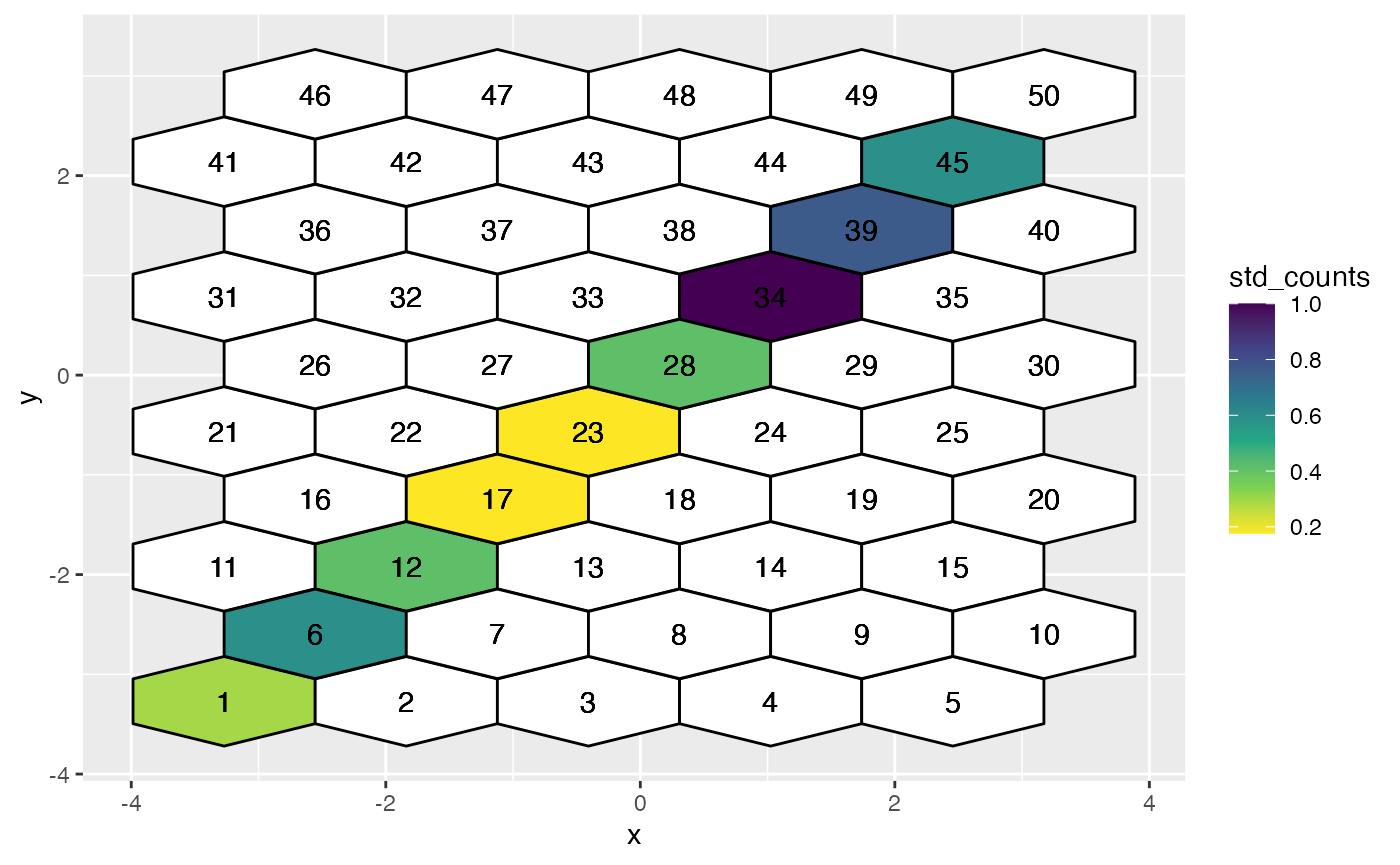
hex_full_count_df <- generate_full_grid_info(df_bin_centroids)

ggplot(data = hex_full_count_df, aes(x = x, y = y)) +
  geom_polygon(color = "black", aes(group = polygon_id, fill = std_counts)) +
  geom_text(aes(x = c_x, y = c_y, label = hexID)) +
  scale_fill_viridis_c(direction = -1, na.value = "#ffffff")